Detailed Analytics
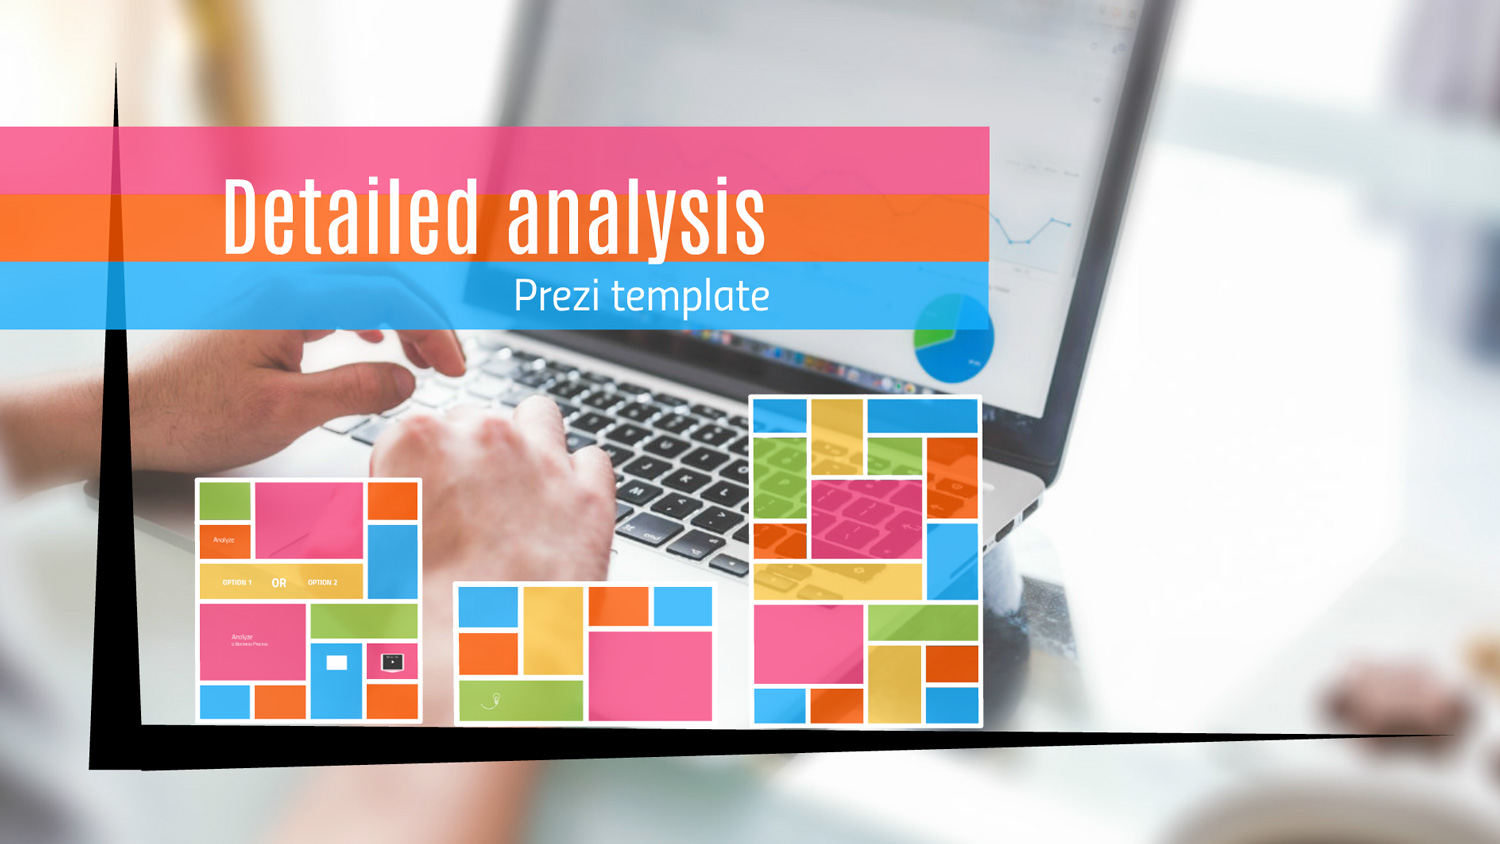
Businessman’s hands are typing financial data into a computer.
Screen are filled with graphics and charts while hands are working on a laptop computer.
An entrepreneur is analyzing business data from his notebook.
Close-up of graph and charts analyzed by businessmen.
Statistics Concept with the colorful user interface made from gradient squares arranged as a bar graph.
The modern computer on table showing charts.
All rectangles are editable, made from Prezi shapes. Change color, rearrange, delete.
Recommended for topics – Analytics Tools for Marketers, Analyzing, Interpreting and Reporting, Reporting Results etc.
Add Prezi symbols and shapes.
Add videos and images.

