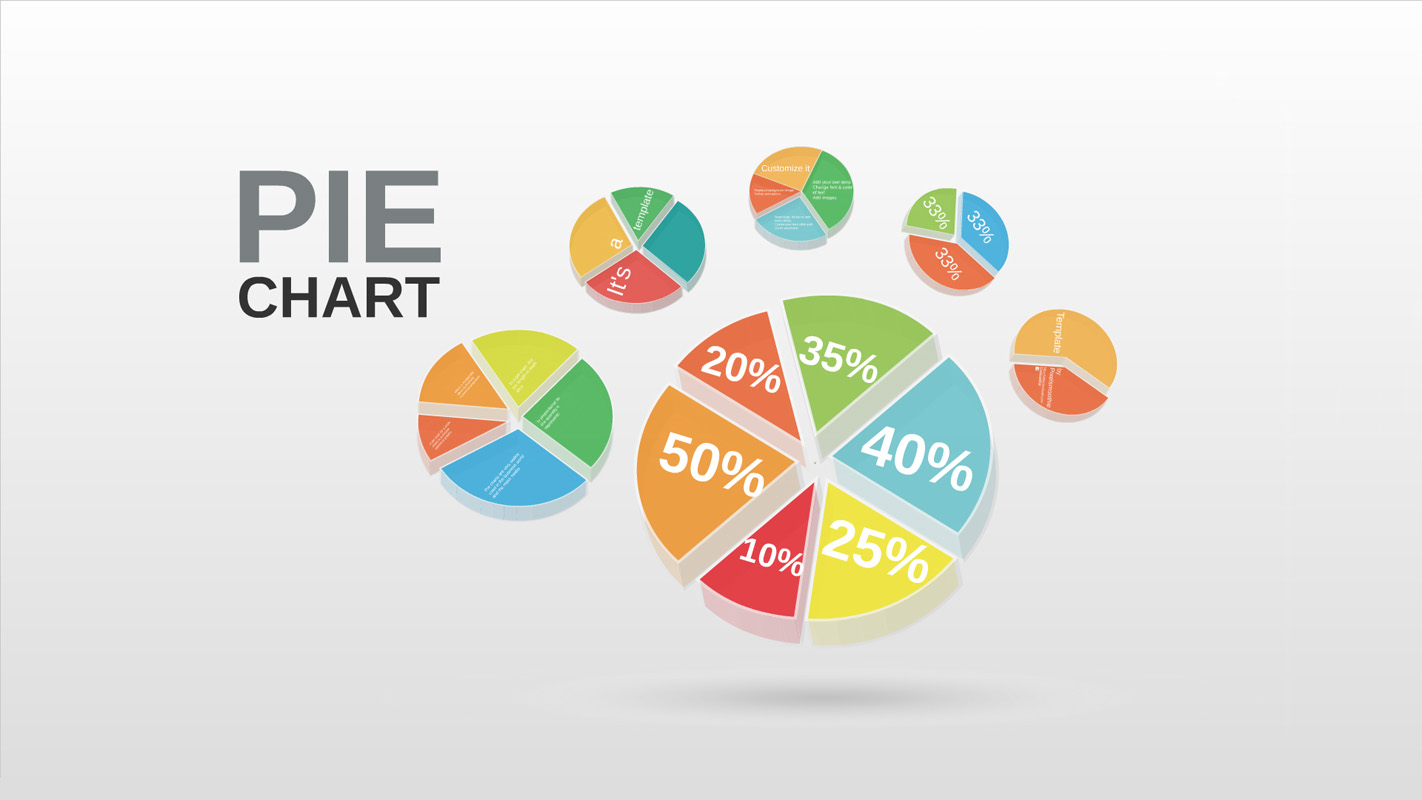
Prezi Presentation Template 3D Pie chart is for describing statistics and information.
Pie chart is colorful, transparent and vector based infographic element.
It circular statistical graphic is divided into slices to illustrate numerical proportion.
Can change text, zoom and move pie charts. It comes with 2, 3, 4, 5, 6 slices.
All pie charts are individual vector elements.

