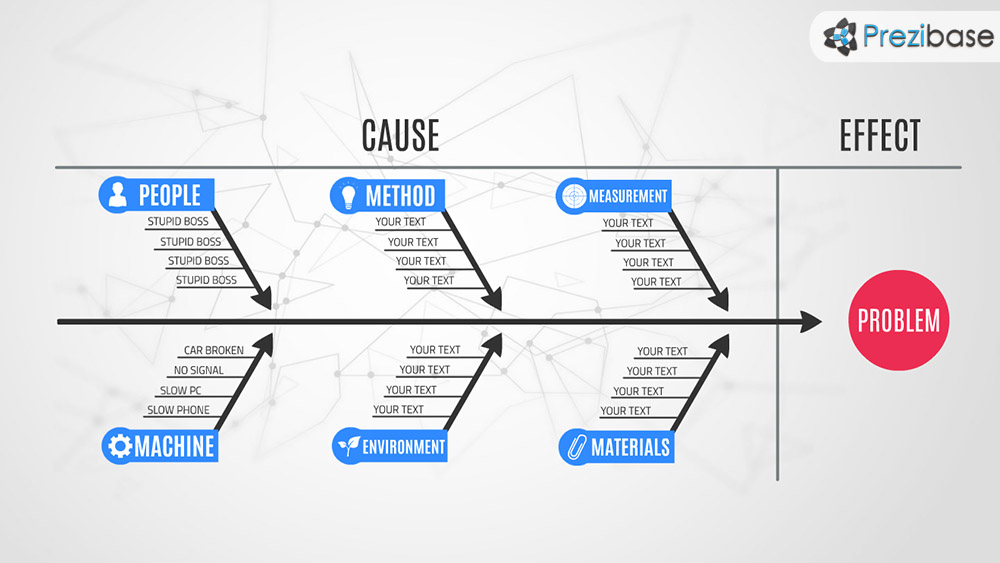
A classical cause and Effect Diagram, also known as the Ishikawa or fishbone Diagram.
Show the problem and describe what has caused it. Brainstorm the main reasons:
Methods, Machines (equipment), People (manpower), Materials, Measurement and Environment.
Zoom into each branch and present you ideas. Ask the questions why, what, when, where, and how.
A generic and simple template for creating a basic diagram or mind map about a problem or topic.
Customize each element by changing the position, size and shape.
